Control room software for real-time data monitoring and efficient operations.Control room software for real-time data monitoring and efficient operations.

Control Room Software Built for Critical Decisions

Deliver crystal-clear, real-time visibility across your entire network. Primate’s control room software turns complex grid data into interactive, wall-scale visualizations, helping operators cut response times, reduce alarm overload, and prevent costly outages.

Request a Demo

From Weeks to Hours: $150K Saved Every Year

Primate’s Network Model lets operators complete grid updates in 4 hours instead of 80, cutting dependency on engineers, eliminating backlogs, and typically saving over $150,000 per year in labor costs.

$150K+

annual labor savings

96%

faster update time

Real-Time Monitoring vs $6.7B Blackout

During the 2003 Northeast blackout, alarm failures left operators blind for over 90 minutes.Primate’s real-time EMS health monitoring would have caught the failure instantly, preventing cascading outages and billions in economic losses.

$6.7B

loss avoided

90+

min faster operator response

Preventing $1M-a-Day Penalties

NERC violations for missed contingencies can cost utilities millions daily. Primate continuously monitors data quality and system limits, instantly flagging potential breaches to help keep operations compliant and penalty-free.

$1M/day

fines prevented

3

key NERC standards covered

One Visualization. $100M in Mission Costs Saved

A detected anomaly nearly grounded a million-dollar launch. Primate’s visualization revealed it was outside the critical zone, preventing an unnecessary cancellation and saving hundreds of millions in wasted preparation.

$100-$150M

loss avoided

0

false aborts

Turning $1.7M Outages Into Minutes of Downtime

Average grid outages last 5.8 hours and cost $1.7M in downtime and penalties. Primate’s fault detection helps operators isolate and resolve issues fast, often restoring power in minutes instead of hours.

$1.7M

saved per outage

83%

faster recovery time

Stopping $300K-an-Hour Downtime Before It Starts

Each hour of downtime costs electric utilities around $300K. Primate’s continuous visualization spots anomalies before they escalate, keeping systems online, reliable, and efficient around the clock.

$300K/hr

loss prevented

24/7

intelligent alarming

Built for Every Role in the Control Room

Icon of connected nodes representing unified control room integration

Operators

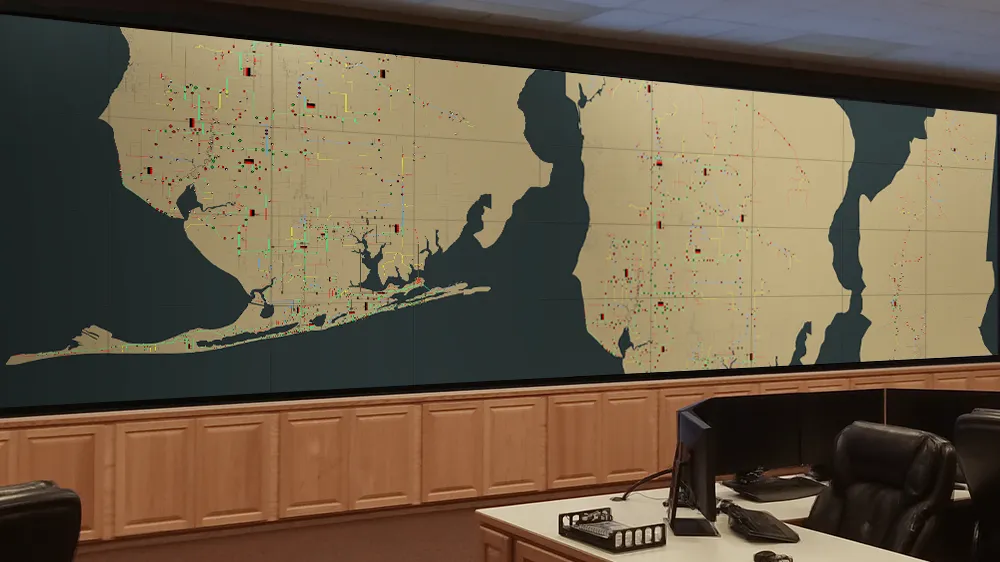
See all your data on one actionable display with visual awareness that drives faster, safer responses. Primate’s control room software simplifies complex data, reduces alarm fatigue, and lets you act confidently under pressure.

Lock icon with a plus sign symbolizing physical and cyber security monitoring

Operations Managers

Monitor performance and resource health across every system from one dashboard. Identify issues early, make data-backed decisions, and improve uptime without adding complexity to your workflow.

magnifying glass icon representing geospatial and external data integration

Security & Compliance Teams

Maintain operational visibility with detailed system monitoring and event tracking. Primate’s control room software supports NERC-aligned practices, giving clear insight into system activity, configuration changes, and operator responses.

Bar chart icon symbolizing complex network data analysis for decision-making

Executive Leadership

Gain a complete operational overview through high-level dashboards designed for strategic visibility. Track performance metrics, assess risks, and make faster, more informed business decisions.

Stacked documents icon representing seamless access to crucial system insights

Public Relations

Access real-time visual updates and system data for transparent communication during public incidents or outages. Strengthen credibility and trust by providing accurate, verified information directly from your control room.

Why Primate Leads in Control Room Software

Built for mission-critical operations, Primate delivers unmatched clarity, speed, and reliability. Each component of the Primate system is engineered to keep your operations stable and your teams in sync, no matter the load or complexity. 

Primate delivers:

Enhanced situational awareness

Enhanced situational awareness

Streamlined operational control

Faster operational response

Faster decision-making capabilities

Unified real-time visualization

Faster decision-making capabilities

Secure, compliant architecture

Faster decision-making capabilities

Automated anomaly detection

Faster decision-making capabilities

Proven reliability at scale

Icon of interconnected screens representing unified data visualization

Unified Data Visualization

Combine every data source into one clear, customizable view for faster & better decisions.

Icon of a video wall symbolizing intelligent display management

Intelligent Display Management

Design custom dashboards and video wall content for your specific operational demands.

Icon of a person with a screen representing real-time monitoring capabilities

Real-time Monitoring

Anticipate issues early with continuous system visibility and automated alerts.

Checkmark icon symbolizing secure compliance with industry standards

Secure Compliance

Maintain operational visibility with the insights you need to meet CIP, NERC & industry compliance standards.

Ready to try the next generation of control room software? 

How Primate Technologies Works

Outside System

Outside System
Outside System

Corporate Systems

Network Operations

Data Warehouse

Historians

AVL

Outage Managment

Weather

Messaging

Messaging
Messaging

Executive Messaging

Customer Messaging

SO Messaging

SMS Alerts

Directives

Applications / Studies / Sims

Applications / Studies / Sims
Appication / Studies / Sims

Contingency Analysis

Network Analysis

Locational Marketing Pricing

State Estimator

Primate Technologies gorilla logo inside a red ring with 'Analyze' and 'Aggregate' textPrimate Technologies gorilla logo inside a red ring with 'Analyze' and 'Aggregate' text
Geographic Integration

Geographic Integration

Geographic Integration

Fires

Weather Radar

AVL/Crew Location

Assets

Severe Weather Alerts

Man Down

Fault Location

Detail

Schematic or Geospatial Overview

Lightning

Control Systems

Control Systems
Gas Pipelines

SCADA

GMS

EMS

OMS

ADMS

TCMS

Alternate Sources

Alternate Sources
Alternate Sources

Listening to Field Devices

Data Concentrators

Phasor Measurement Units

Synchrophasors

Gas Pipelines

Gas Pipelines
Gas Pipelines

Flow Constraints

Alternative Fuels

Unit Supply Duration

Natural Language Processing

Security

Security
Security

Door/Entry Alarms & Logs

Physical

Perimeter Detection

Physical

Video

Cyber

White Listing

Physical

Intrusion Detection

Cyber

Natural Language Processing

Physical

.

Red downward arrow with 'Visualize' text, part of Primate Technologies' data process
Primate Technologies gorilla alongside a data flow diagram, representing advanced control room solutions

Elevate awareness. Enhance control. Empower your operators

Advanced Control Room Solutions

From real-time monitoring to advanced analytics, every tool is built to enhance awareness, reduce response times, and deliver precision under pressure.

Industries We Power

From grid operations to emergency management, Primate’s control room software supports the systems that keep critical infrastructure running safely and efficiently.

Arrow pointing right

Electric Transmission & Distribution

Arrow pointing right

Pipeline Operations

Arrow pointing right

Gas Utilities

Arrow pointing right

Mission-Critical Operations

Arrow pointing right

Transportation

Handshake overlaid with power lines, representing trusted control room solutions for critical industries

News & Resources

Ready to experience the clarity and control only Primate delivers?

Frequently Asked
Questions

What makes your dashboards different from others?
Most systems display images that can blur or lose detail when scaled. Primate’s control room software uses vector rendering for crystal-clear visualization at any scale. Dashboards and wall displays remain sharp and fully interactive, allowing operators to zoom, layer, and customize views without losing accuracy or speed.
How does Primate handle data reliability?
Primate’s architecture is built for continuous uptime. It features redundant data streams, real-time health monitoring, and failover protection to ensure uninterrupted visualization, even if one system experiences a fault or communication delay.
Can your control room software work with our older setup?
Yes. Primate was built to integrate with legacy and modern systems alike (SCADA, EMS, ADMS, GIS & more). It connects securely through APIs or existing communication protocols, allowing utilities to modernize their control rooms without a full system replacement or long downtime.
How does Primate reduce display maintenance costs?
Primate's Network Model dramatically accelerates backend display maintenance. Engineering teams can complete grid display updates in 4 hours instead of 80, a 95% reduction in maintenance time. This eliminates backlogs, reduces dependency on specialized engineers, and typically saves utilities over $150,000 per year in labor costs.
What does the Primate implementation process look like?
Every deployment starts with a scoped project plan tailored to your environment. Our team handles discovery, system integration, configuration, and testing, working closely with your operators throughout. We provide hands-on training and validation before go-live. This phased approach keeps your control room fully operational while we build and test in parallel.
Close icon

Unlock the Video

Thank you! Your submission has been received!
Oops! Something went wrong while submitting the form.